
Looksmaxxing Chart: The Full 0–8 Tier Chart, Explained
A looksmaxxing chart that puts every tier on one 0–8 line: Sub3, LTN, MTN, HTN, Chadlite, Chad and True Adam, with ranges, rough percentiles and how to read it.
A looksmaxxing chart is a single picture of the 0 to 8 PSL scale split into tiers, from Sub3 at the bottom to True Adam or True Eve at the top. This looksmaxxing chart shows the score range of each tier, the community names, a rough percentile, and how to find your own place on it. It is a convention built by online communities, not a scientific scale, so use it as a map and not as a verdict.
The looksmaxxing chart at a glance
The chart below is the one used on this site. Each row is a tier, and the shape of the scale is a bell curve centred on about 4: most people sit in the middle tiers, and every step up is rarer.
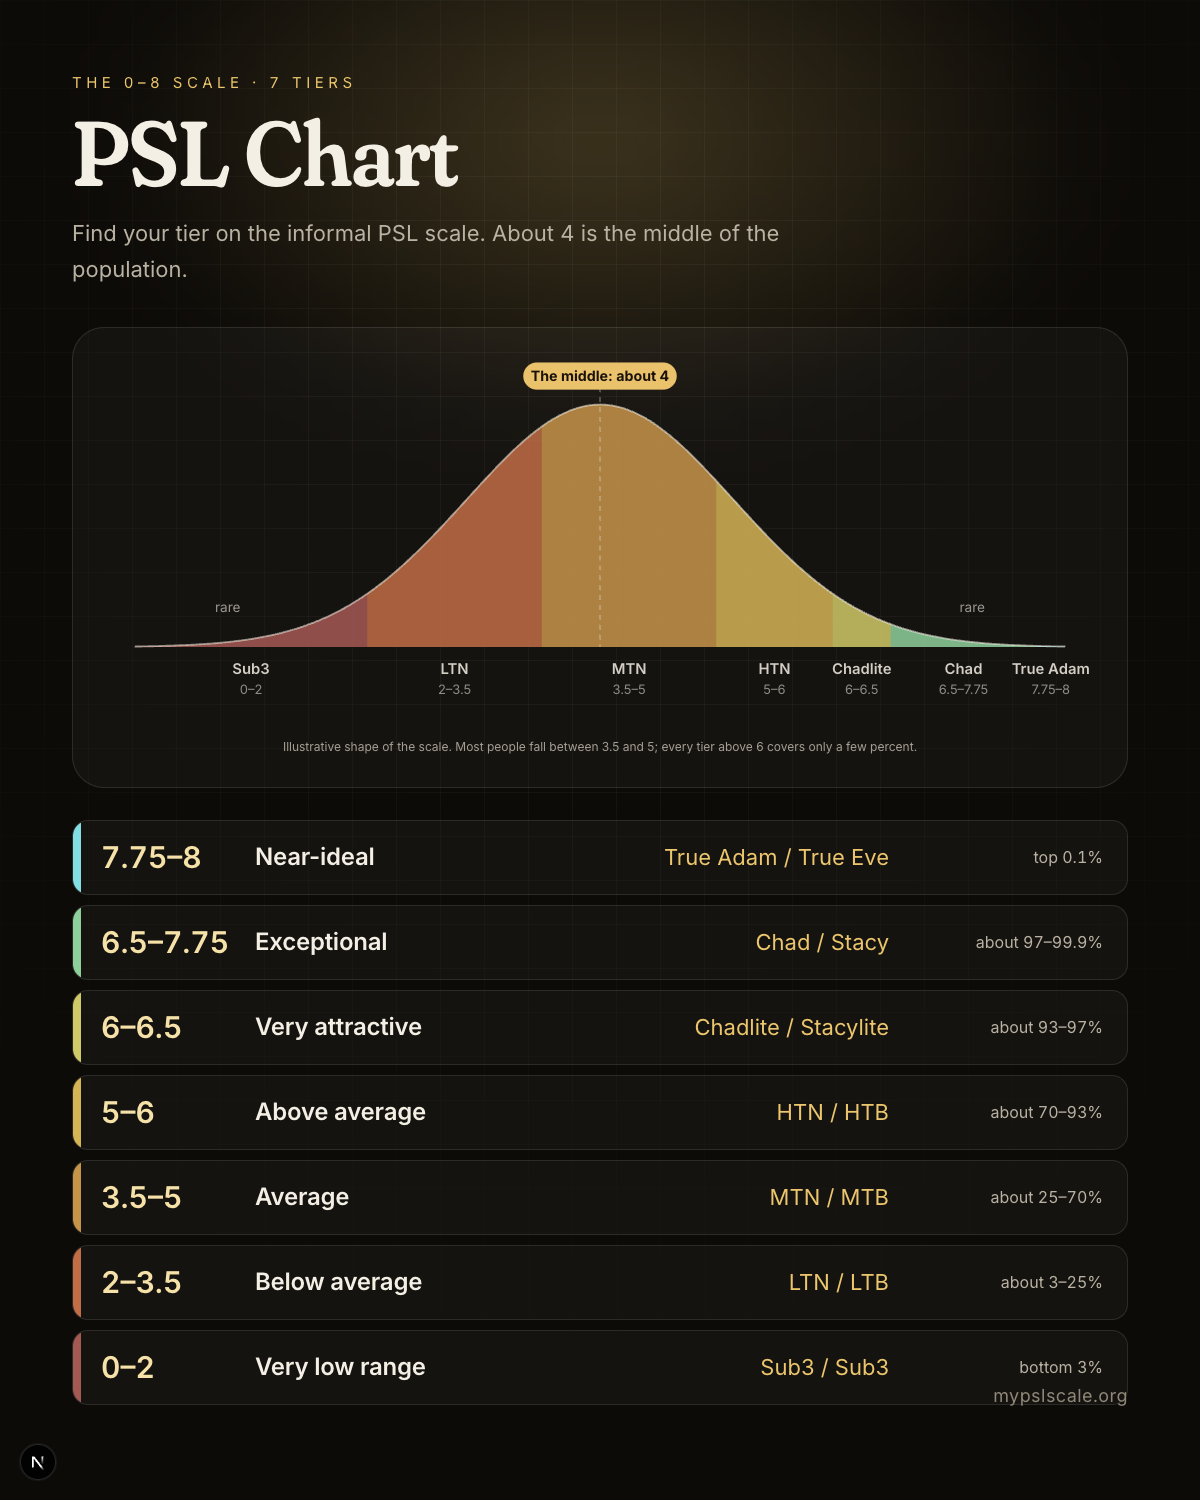
You can also save the image from the PSL chart page and share it.
The looksmaxxing chart as a table
| PSL score | Tier | Community name | Roughly |
|---|---|---|---|
| 0 – 2 | Very low range | Sub3 | bottom 3% |
| 2 – 3.5 | Below average | LTN / LTB | about 3–25% |
| 3.5 – 5 | Average | MTN / MTB | about 25–70% |
| 5 – 6 | Above average | HTN / HTB | about 70–93% |
| 6 – 6.5 | Very attractive | Chadlite / Stacylite | about 93–97% |
| 6.5 – 7.75 | Exceptional | Chad / Stacy | about 97–99.9% |
| 7.75 – 8 | Near-ideal | True Adam / True Eve | top 0.1% |
The percentiles are community estimates, repeated across forums, and nobody has measured them on a real population. Treat them as a feel for the shape, not as a ranking. The slang names are also used differently in different places, which is why this looksmaxxing chart shows a neutral name first.
How to read a looksmaxxing chart
Reading the chart takes four steps.
- Find your score. You need a number from 0 to 8. The free PSL rating tool gives one from a front-facing photo, or you can type measurements into the PSL calculator.
- Locate the row. Match the number to a range. A 5.84 is above average (HTN or HTB); a 4.1 is average (MTN or MTB).
- Ignore small differences. A single photo is an estimate. Half a point is inside the noise, so two scores in the same tier are the same result.
- Look past the tier. The five dimension scores behind the number tell you what is moving it, which is more useful than the name.
Why most people sit in the middle of the looksmaxxing chart
The scale is centred on the middle of the population on purpose, so a result between 3.5 and 5 is the most common and says nothing negative. People new to the chart often read a 4 as a low score because they are used to a 1 to 10 scale, where 5 or 6 is average and 4 sounds poor. On the PSL scale, 4 is typical, 5 to 6 is clearly above average, and the top two tiers are rare enough that most people never see anyone who scores there.
That is also why you should be suspicious of any tool that gives most people a 6 or a 7. A tool that flatters everybody has stopped measuring. On this site the same face can land at 6.44 in a straight-on photo and 4.41 when it is shot too close with a wide-angle lens, and the tool warns you about the photo before it scores it.
What the looksmaxxing chart cannot tell you
The chart describes facial structure in a photograph and nothing else. It does not capture expression, grooming, style, voice or the way someone moves, which shape how attractive a person seems in real life far more than a few millimetres of proportion. It is not a measure of anyone's worth, and it is not medical or cosmetic advice. If a number on the chart makes you feel worse, that is a reason to look at the measurements behind it, not at the tier name.
Looksmaxxing chart FAQ
What is a looksmaxxing chart? A looksmaxxing chart is a diagram or table that maps the 0 to 8 PSL scale to named tiers, so that a score like 5.2 can be described as high-tier normie. Every looksmaxxing chart you will find online is built on the same seven tiers, with small differences in where the lines are drawn.
Is a looksmaxxing chart accurate? No looksmaxxing chart is a scientific instrument. The tiers and percentiles come from forum practice, so use a looksmaxxing chart to understand vocabulary and to see roughly where a number sits.
Is there a looksmaxxing chart for women? Yes. The numbers are the same and only the community names and the ideal measurement bands change, as the women's chart shows. A woman with a score of 6.7 would be called a Stacy on a looksmaxxing chart.
How do I find my place on a looksmaxxing chart? Get a score first, then read across. A photo tool or the calculator gives you the number, and the looksmaxxing chart above turns it into a tier.
Where to go next
- The longer story of the scale is in the PSL scale guide.
- What each number means in plain language is in PSL score meaning.
- The method, including every measurement and ideal band, is in how the PSL rating works.
- Women's tier names and bands are in the PSL scale for women.