
THE FULL CHART · 7 TIERS
PSL Chart: The Full 0–8 Tier Chart
The PSL chart maps the 0 to 8 PSL scale into seven tiers, from Sub3 to True Adam or True Eve, with about 4 as the middle of the population. Use the chart below to find your tier, see the community names for men and women, and download it as an image.
Last updated:
01 · Read the scale as
Changes the ideal bands and tier names only.
02 · Add a front-facing photo
- Look at the lens, neutral face, mouth closed
- Soft, even light. No flash, no filters
- Hair off the forehead, camera at eye level
Mapped inside your browser: the free score never uploads your photo. New accounts get 10 free credits for one AI rating.
The PSL chart
Higher tiers are rarer: the top two cover only a few percent of people. The shape below is illustrative; the cards underneath give the exact ranges.
- 7.75–8top 0.1%
Near-ideal True Adam / True Eve
The extreme end of the scale; almost no one scores here.
- 6.5–7.75about 97–99.9%
Exceptional Chad / Stacy
Top-percent range; rare in the general population.
- 6–6.5about 93–97%
Very attractive Chadlite / Stacylite
Strong across nearly every measure.
- 5–6about 70–93%
Above average HTN / HTB
Clearly above the middle, with most features in or near the ideal bands.
- 3.5–5about 25–70%
Average MTN / MTB
The middle of the population. Most people land here.
- 2–3.5about 3–25%
Below average LTN / LTB
Below the typical range; several features sit away from the ideal bands.
- 0–2bottom 3%
Very low range Sub3 / Sub3
Far below the typical range on most measured features.
The PSL chart as a table
| PSL | Tier | Male / female | Roughly |
|---|---|---|---|
| 7.75 – 8 | Near-ideal | True Adam / True Eve | top 0.1% |
| 6.5 – 7.75 | Exceptional | Chad / Stacy | about 97–99.9% |
| 6 – 6.5 | Very attractive | Chadlite / Stacylite | about 93–97% |
| 5 – 6 | Above average | HTN / HTB | about 70–93% |
| 3.5 – 5 | Average | MTN / MTB | about 25–70% |
| 2 – 3.5 | Below average | LTN / LTB | about 3–25% |
| 0 – 2 | Very low range | Sub3 / Sub3 | bottom 3% |
How to read the PSL chart
- 1
Get your PSL score
Run the free tool above with a front-facing photo. You get a number from 0 to 8.
- 2
Find the row
Match your number to a range in the chart. The neutral tier name is on the left, the community names next to it.
- 3
Check the percentile
Read the rough percentile for the tier. It is a community estimate, so treat it as a feel for the shape, not a ranking.
- 4
Look at your dimensions
Your dimension scores show what moves you up or down the chart, which is more useful than the tier name.
Download the PSL chart
Save the chart as an image to keep or share. It shows all seven tiers, the score ranges, the community names and the shape of the scale.
Download the PSL chart (PNG)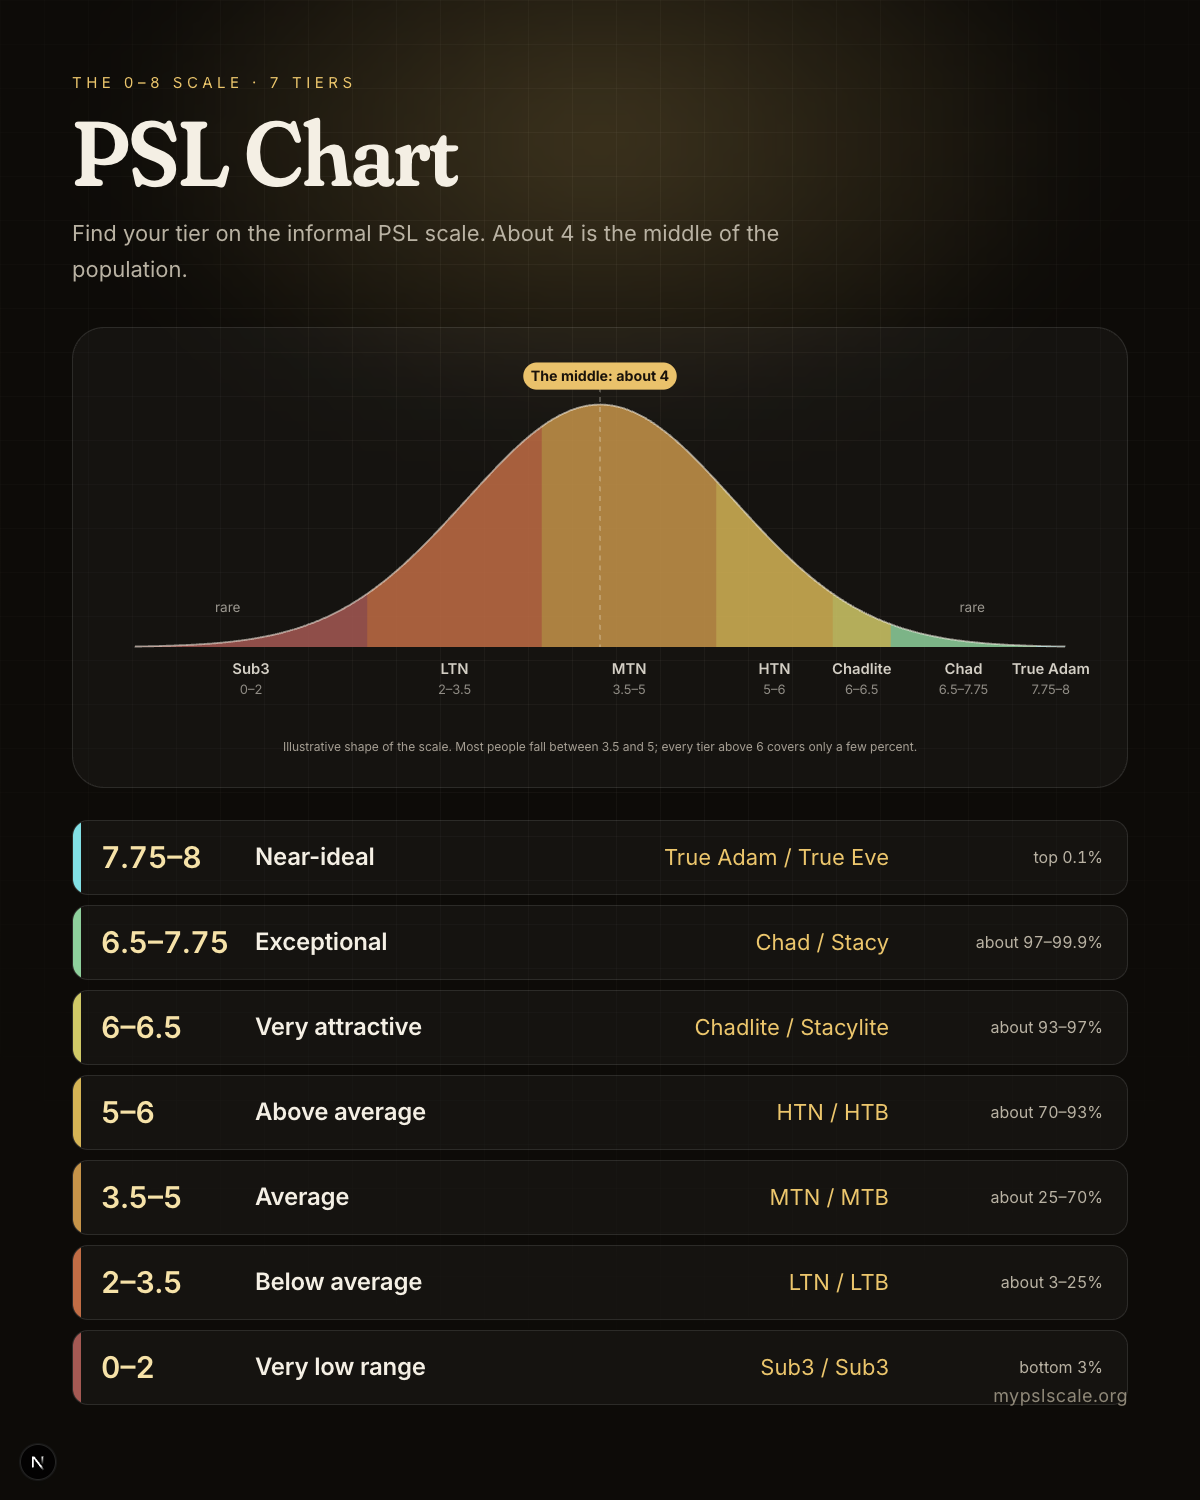
Reading the chart without overthinking it
The chart is a map, not a verdict. A single photo is an estimate, the tiers are a convention, and half a point is inside the noise. If you want to see where you land, the free tool gives a score and the five dimension scores behind it. For the plain-language meaning of each number, read PSL score meaning; for the longer story of the scale, see the PSL scaleguide; and for women's names and bands, see the PSL scale for women.
Frequently asked questions
Ready to see where you land?
The on-device score is free, needs no account, and never uploads your photo.
Find my place on the chart